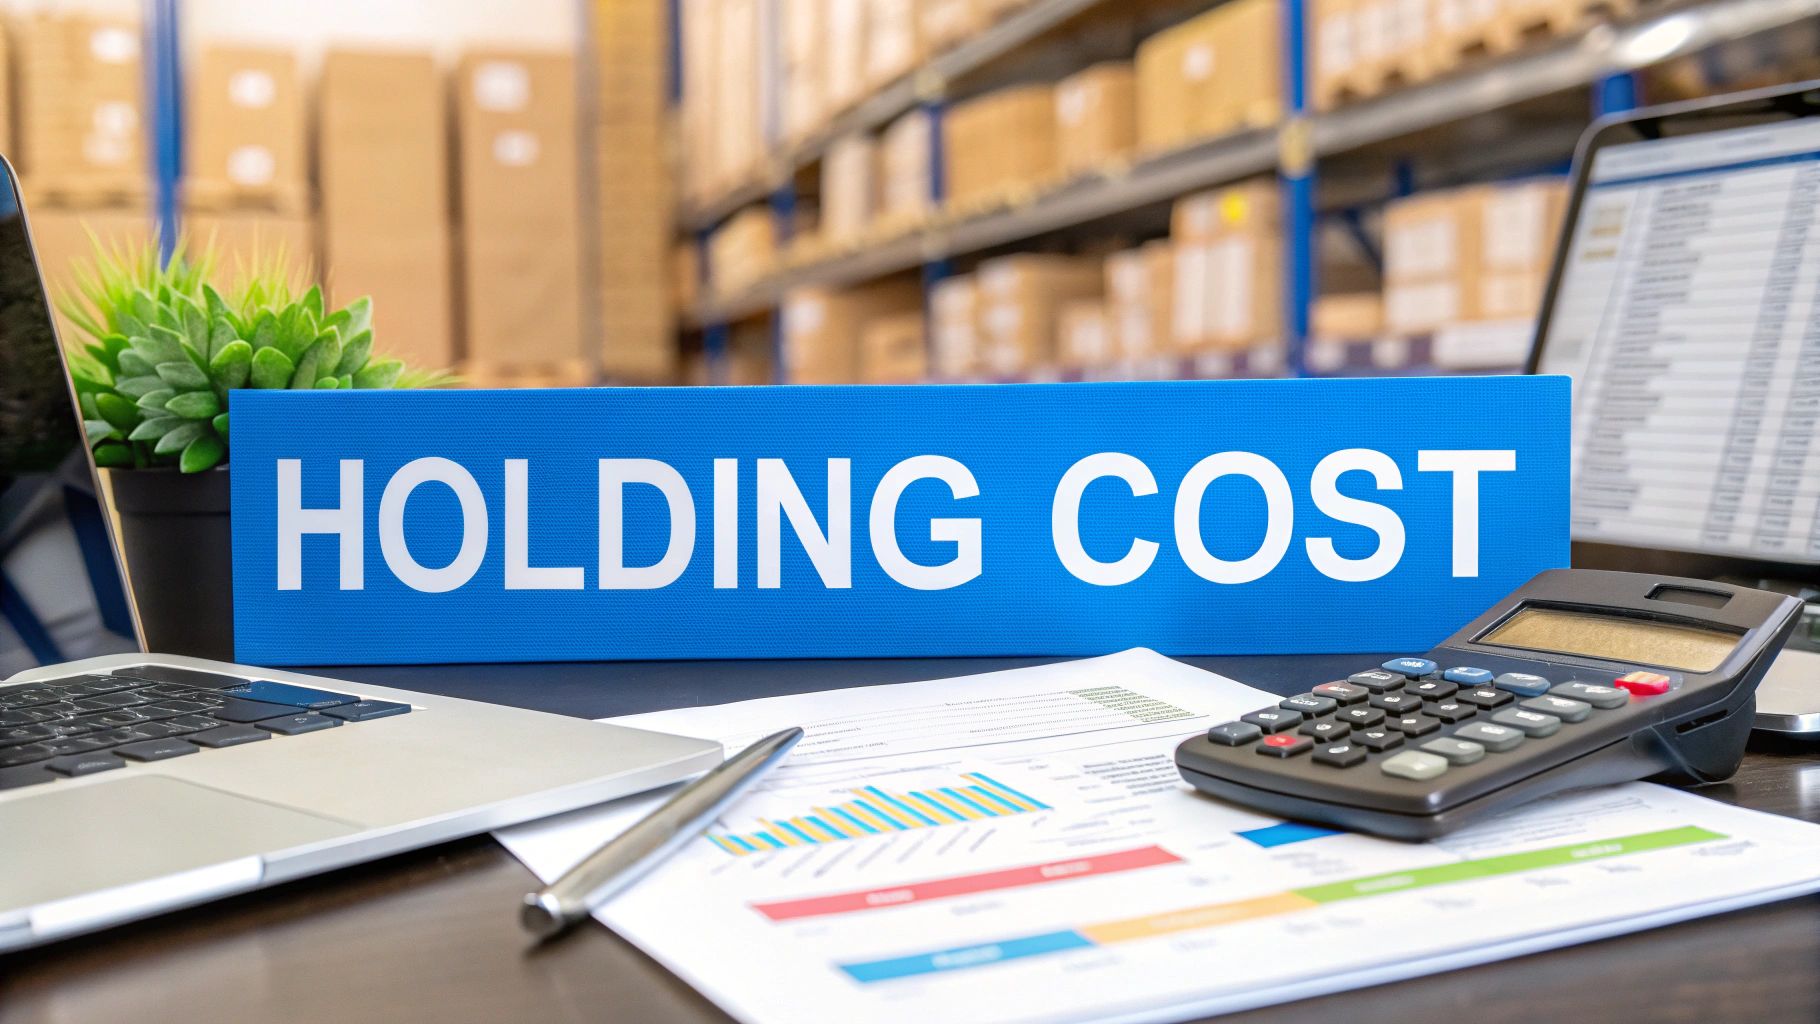
Inventory holding cost is one of those sneaky expenses that can quietly eat away at your profits. It’s the total cost of storing all your unsold inventory, and it typically eats up a staggering 20-30% of your total inventory value every year.
Think of it as a silent partner in your business—one that gets paid whether you make a sale or not.
What Is Inventory Holding Cost And Why Does It Matter
This isn't just about warehouse rent. Your inventory holding cost—often called carrying cost—is a critical business metric that digs much deeper, directly impacting your profitability. Getting a firm grip on this number shows you exactly where your cash is tied up and can shine a light on hidden problems in your operations.
If you're curious about the finer points, we've broken down the key differences between carrying cost and holding cost before, but for most ecommerce brands, the terms are used interchangeably.
Ultimately, getting this number right is the first real step toward improving your cash flow and making smarter purchasing decisions. It’s what separates businesses that see inventory as just stuff on a shelf from those who understand its true financial footprint.
The Four Pillars of Inventory Holding Cost To really nail down your holding cost, you have to look beyond the obvious expenses. The total figure is actually a sum of four distinct categories, each chipping in to the total cost of keeping products on your shelves.
Here’s a quick breakdown of the four main categories you need to track to get your total inventory holding cost.
Cost Category What It Covers Real-World Examples Capital Costs The money tied up in your stock, including purchase price and financing interest. This also covers the opportunity cost —what you could've earned if that money were invested elsewhere. Product purchase price, interest on business loans for inventory, potential investment returns. Storage Costs The most tangible expenses related to the physical space where your inventory lives. Warehouse rent or mortgage payments, utilities (heating, cooling, electricity), security systems. Service Costs All the expenses related to managing and protecting the inventory while it's in storage. Insurance premiums, property taxes, inventory management software subscriptions (like Cin7 or Skubana). Risk Costs The potential financial losses associated with holding physical products over time. Shrinkage (theft or damage), obsolescence (products becoming outdated), spoilage (for perishable goods).
By tracking these four pillars, you turn a vague, fuzzy expense into a hard number you can actually manage.
This clarity is empowering. It lets you pinpoint specific areas for cost reduction, like finding ways to optimize your warehouse layout or improving your demand forecasting to cut down on the risk of products becoming obsolete.
Understanding and accurately calculating these costs is a cornerstone of smart inventory management. To see how this fits into the bigger picture of optimizing your stock, check out these effective Amazon inventory management strategies .
Breaking Down the Four Core Cost Components To get a real handle on your inventory holding cost, you have to look past the obvious expenses like your monthly warehouse rent. The true cost is a sum of four distinct parts, and if you miss one, your calculations will be dangerously off.
Think of it like this: your total holding cost is made up of Capital , Storage , Service , and Risk costs. Each one is a bucket you need to fill with very specific expenses. Let's break down what goes into each.
Capital Costs: The Price of Tied-Up Money This is the big one, and it’s the cost component that most businesses forget. Capital cost is all about the opportunity cost of having your money locked up in inventory. Every dollar you’ve spent on products sitting on a shelf is a dollar you can't use for anything else—like investing in a marketing campaign, paying down debt, or even just earning interest in the bank.
This isn't just a theoretical number. You can calculate it. Start by tallying up the total value of your inventory. A good rule of thumb is that opportunity costs can easily be 10-20% of your inventory's value, especially with interest rates floating around 5-7% in markets like the US and EU. This bucket also includes any direct interest you're paying on loans you took out to buy that stock in the first place.
Key Takeaway: Every dollar sitting on your shelf as unsold inventory is a dollar that isn't working for you. This "silent" cost is real and has a significant impact on your financial flexibility and growth potential.
Storage Space Costs: Beyond the Rent Check This part feels the most straightforward, but it’s easy to undercount. Storage cost is more than just your rent or mortgage payment—it’s every single expense tied to the physical space your inventory occupies.
You need to account for all the operational costs that keep the lights on and the space functional:
Utilities: Electricity for lights, HVAC for climate control (a huge expense for sensitive products), and water.Security: This covers everything from alarm monitoring services and surveillance cameras to security guards.Property Taxes: If you own the building, this is a major recurring storage cost you can't ignore.These costs add up faster than you’d think. A poorly insulated warehouse in a cold climate, for instance, could have sky-high heating bills that substantially inflate your total storage expenses. If you're struggling to make sense of these expenses, our guide on understanding carrying costs in detail can provide additional clarity.
Service Costs: The Price of Management This bucket is for all the costs tied to actually managing and handling your inventory. It’s the human and technological side of the equation. Without these services, your warehouse would be a chaotic, uninsured mess.
Make sure you’re including these essential service expenses:
Insurance: You absolutely need a policy to protect your inventory from fire, theft, and other disasters.Software: Those monthly or annual fees for your Inventory Management System (IMS) or Warehouse Management System (WMS) belong here.Labor: This is a big one. It includes the salaries and wages for the team members who receive, shelve, pick, pack, and manage your stock day in and day out.Risk Costs: The Inevitable Losses Finally, you have to account for the simple fact that holding physical goods comes with inherent risks and unavoidable losses. No matter how buttoned-up your operation is, some inventory loss is going to happen, and you need to factor it into your calculations.
The primary types of risk are:
Shrinkage: This is the industry term for inventory lost to employee theft, administrative errors (like miscounts), or damage in the warehouse.Obsolescence: This happens when products become outdated, expire, or fall out of fashion before you can sell them. It’s a massive risk for businesses in fast-moving industries like tech and apparel.Spoilage: If you sell perishable goods, this is a constant threat. Every product that goes bad on the shelf is a direct hit to your bottom line.The Essential Formulas for Your Calculation Once you've tallied up all the individual expenses from the four core components, it's time to put those numbers to work. The math behind calculating inventory holding cost is surprisingly straightforward, and it boils down to two key formulas that give you a complete financial picture.
These aren't just academic exercises; they transform a long list of expenses into powerful metrics you can use to make smarter business decisions.
First, you'll calculate your Annual Holding Cost Percentage . This is the 30,000-foot view, telling you what percentage of your inventory's total value is being eaten up by holding costs each year. It's the most common way businesses track this expense and is perfect for strategic planning and financial health check-ups.
Second, you'll drill down to the Per-Unit Holding Cost . This granular detail shows you exactly how much each individual item is costing you while it sits on the shelf. This is incredibly useful for fine-tuning your pricing strategies and identifying which products are quietly becoming a financial drain.
This process flow visualizes the four cost pillars that feed into your total holding cost calculation.
As you can see, each component—from capital to risk—contributes directly to the final sum you'll use in the formulas.
Calculating Your Annual Holding Cost Percentage This is the most crucial formula for understanding your overhead. It expresses your total holding costs as a percentage of your total inventory value, giving you a clear benchmark for performance.
The formula is simple:
Holding Cost % = (Inventory Holding Sum / Total Value of Average Inventory) x 100
Let's break that down:
Inventory Holding Sum: This is the grand total of all your costs from the four pillars (Capital + Storage + Service + Risk) over a one-year period.Total Value of Average Inventory: This is the average value of all the inventory you had on hand during that same year. Don't just pick one day's value; calculating an average gives you a much more accurate picture.I once worked with a mid-sized e-commerce retailer who discovered their holding costs were eating up a whopping 30% of their inventory value—far above the industry average of 20-25% . This eye-opening figure, which came from applying this exact formula, prompted a major overhaul of their purchasing strategy. You can discover more insights on holding cost benchmarks and see how you stack up.
Finding Your Per-Unit Holding Cost While the percentage is great for a big-picture view, sometimes you need to know exactly how much a single, specific item is costing you. This is where the per-unit calculation comes in.
Here's the formula:
Per-Unit Holding Cost = (Holding Cost % / 100) x Per-Unit Cost
And what you'll need:
Holding Cost %: The percentage you just calculated above.Per-Unit Cost: The amount you paid your supplier for a single unit of the product in question.Let's walk through a real-world scenario. Imagine a small e-commerce business that sells artisanal coffee. They've already calculated their annual holding cost percentage to be 22% . One of their best-selling bags of coffee has a per-unit cost of $9.00 .
Plugging that into the formula:$1.98
This means for every year that one bag of coffee sits unsold on their shelf, it costs them $1.98 in holding expenses alone. This simple calculation turns an abstract percentage into a tangible dollar amount, making it painfully clear what the true cost of overstocking really is.
Building Your Own Holding Cost Tracking Spreadsheet While the formulas give you the theory, a good old-fashioned spreadsheet is where you turn that theory into a practical, repeatable tool for making smarter decisions. Building your own holding cost calculator in Google Sheets or Microsoft Excel is much easier than you might think, and it creates a system you can easily update each quarter to keep a tight grip on your expenses.
The goal here isn't to build something ridiculously complex. A simple, clean template is all you need to get the clarity you’re after. Just start with a blank sheet and begin listing out all your potential cost components in the first column.
Setting Up Your Cost Categories First things first, you need to create a clear structure. In Column A, go ahead and list every single expense that contributes to your holding costs. The more granular you get, the more accurate your final number will be.
I recommend organizing your sheet with headings for each of the four main cost pillars:
Capital Costs: Have lines for the cost of your inventory itself and any opportunity cost.Storage Costs: Add rows for warehouse rent, utilities, security systems, and property taxes.Service Costs: List your inventory management software fees, insurance premiums, and labor costs for warehouse staff.Risk Costs: Create entries for estimated shrinkage , obsolescence , and spoilage.Then, in Column B, right next to each item, you'll plug in its annual dollar value. Taking this methodical approach ensures you don't forget any of those small, "hidden" costs that love to pile up.
The screenshot below shows how you can format your data as a table in Excel, which makes it much easier to manage and apply formulas later on.
Using a formatted table doesn't just make your data look clean; it also gives you access to powerful sorting and filtering features with just a click.
Implementing the Core Formulas With your costs all laid out, it's time to make the spreadsheet do the heavy lifting. This is where the magic happens automatically. Find an empty cell—let's say B6 if your costs are in B2 through B5—and use the SUM function to add everything up.
Simply type =SUM(B2:B5)Inventory Holding Sum .
Next, you'll need two more key pieces of data in their own cells:
Average Inventory Value: This is the average value of all your stock over the course of the year.Total Units in Stock: The total number of individual items this value represents.From here, calculating your main KPIs is a breeze. To get your Holding Cost Percentage , create a formula that divides your total holding sum by your average inventory value, then multiply by 100 . This is a fantastic metric for tracking how efficiently you're managing your stock.
For an even deeper dive into inventory efficiency, our guide on the days on hand inventory calculation offers some great complementary metrics to track. Creating this simple, repeatable system is what empowers you to make data-backed decisions every single quarter.
Common Mistakes That Skew Your Calculation
Knowing how to calculate inventory holding cost is one thing. Getting a number you can actually trust is something else entirely. Your calculation is only as good as the data you put into it, and I've seen countless businesses make simple, avoidable errors that lead to bad strategic decisions.
These missteps can turn what should be a powerful financial metric into a misleading figure, causing you to either overspend where you shouldn't or make painful cuts in the wrong places. Let's walk through the most common pitfalls I see and how to sidestep them.
Overlooking the Small Stuff One of the biggest mistakes is forgetting all the "hidden" or indirect expenses that pile up over time. It’s easy to remember the big-ticket items like warehouse rent, but it’s the smaller, recurring costs that often inflate your holding cost without you realizing it.
Think about all the little things that add up:
Software Subscriptions: That monthly fee for your inventory management system (IMS) is a direct service cost tied to holding stock.Employee Handling Time: A portion of your warehouse team's salary is absolutely dedicated to managing and moving unsold products.Office Supplies: The cost of labels, packing tape, and boxes used for internal stock movements definitely counts.These seemingly minor expenses are part of the true cost of keeping products on your shelves. If you miss them, you’re consistently underestimating your actual expenses.
Using a Single Snapshot of Inventory Value Another classic blunder is pulling your inventory value from a single day—say, December 31st—and using that for your annual calculation. This is a massive problem for any business with seasonal sales peaks or fluctuating stock levels.
Imagine a toy company that stocks up heavily for the holidays. Using their sky-high inventory value from late December would dramatically inflate their calculated holding cost for the entire year. On the flip side, using a low point from a slow summer month would make their costs appear artificially low.
The only way to get a trustworthy figure is to use your average inventory value over the period you’re measuring. This smooths out the peaks and valleys, giving you a much more realistic view of your typical stock levels and associated costs.
Using a simple average—(beginning inventory + ending inventory) / 2—is critical for getting a final number you can confidently use to guide your strategy. To dig deeper into how averaging impacts your final numbers, you can explore further insights on holding cost calculations . This one adjustment makes all the difference between a guess and a reliable metric.
How Outsourcing Fulfillment Slashes Your Holding Costs Once you've done the math and have a clear picture of your inventory holding costs, the next question is obvious: "How do I get this number down?" For a lot of growing eCommerce brands, the most effective strategy isn't about shuffling pallets or finding a cheaper warehouse. It's about getting out of the warehouse game completely by partnering with a third-party logistics (3PL) provider.
Making this move is like systematically taking apart the engine of your holding costs. You’re not just trimming expenses here and there; you're fundamentally changing your cost structure from fixed and rigid to flexible and scalable. This isn’t just a line-item saving—it’s about freeing up cash and, just as importantly, your time.
Dismantling Fixed Storage and Service Costs The most immediate win you'll see with a 3PL is the disappearance of direct storage costs. Say goodbye to that monthly rent check, the utility bills, and the property taxes. A 3PL operates on a shared-space model, which means you only pay for the exact footprint your inventory takes up, whether that’s a couple of pallets or an entire aisle.
And it’s not just the physical space. A 3PL also absorbs a huge chunk of your service costs. The salaries for warehouse staff, the contracts for security systems, and the subscription for that fancy inventory software—all of that gets rolled into a single, predictable service fee. What was once a messy collection of fixed and variable expenses becomes one clear operational cost.
Key Takeaway: Outsourcing fulfillment flips your financial model from high fixed overhead to a variable cost structure. This unlocks a significant amount of capital that can be poured back into marketing, product development, or other activities that actually grow your brand.
Reducing Risk and Improving Efficiency A professional fulfillment partner is also built to tackle your risk costs head-on. With dedicated teams, advanced security, and climate-controlled facilities, 3PLs are experts at minimizing losses from shrinkage, damage, and spoilage. They're in the business of protecting the value of your inventory.
Thinking strategically like this is where the power of modern data comes into play. Gaining clear insights through real-time analytics use cases is how top-tier logistics operations stay ahead of problems and continuously optimize.
Consider this: one retailer managed to slash their holding cost percentage to 22% simply by using better demand forecasting to optimize their stock levels. That move freed up $16,000 a year, which they immediately funneled back into their marketing budget. Small changes, big impact.
Ultimately, working with a 3PL is more than just a cost-cutting move. It's a strategic decision to hand off the operational headaches so you can focus on what you're best at: building and selling your products. To get a better feel for how this relationship works in practice, check out our deep dive on what it means to outsource fulfillment .