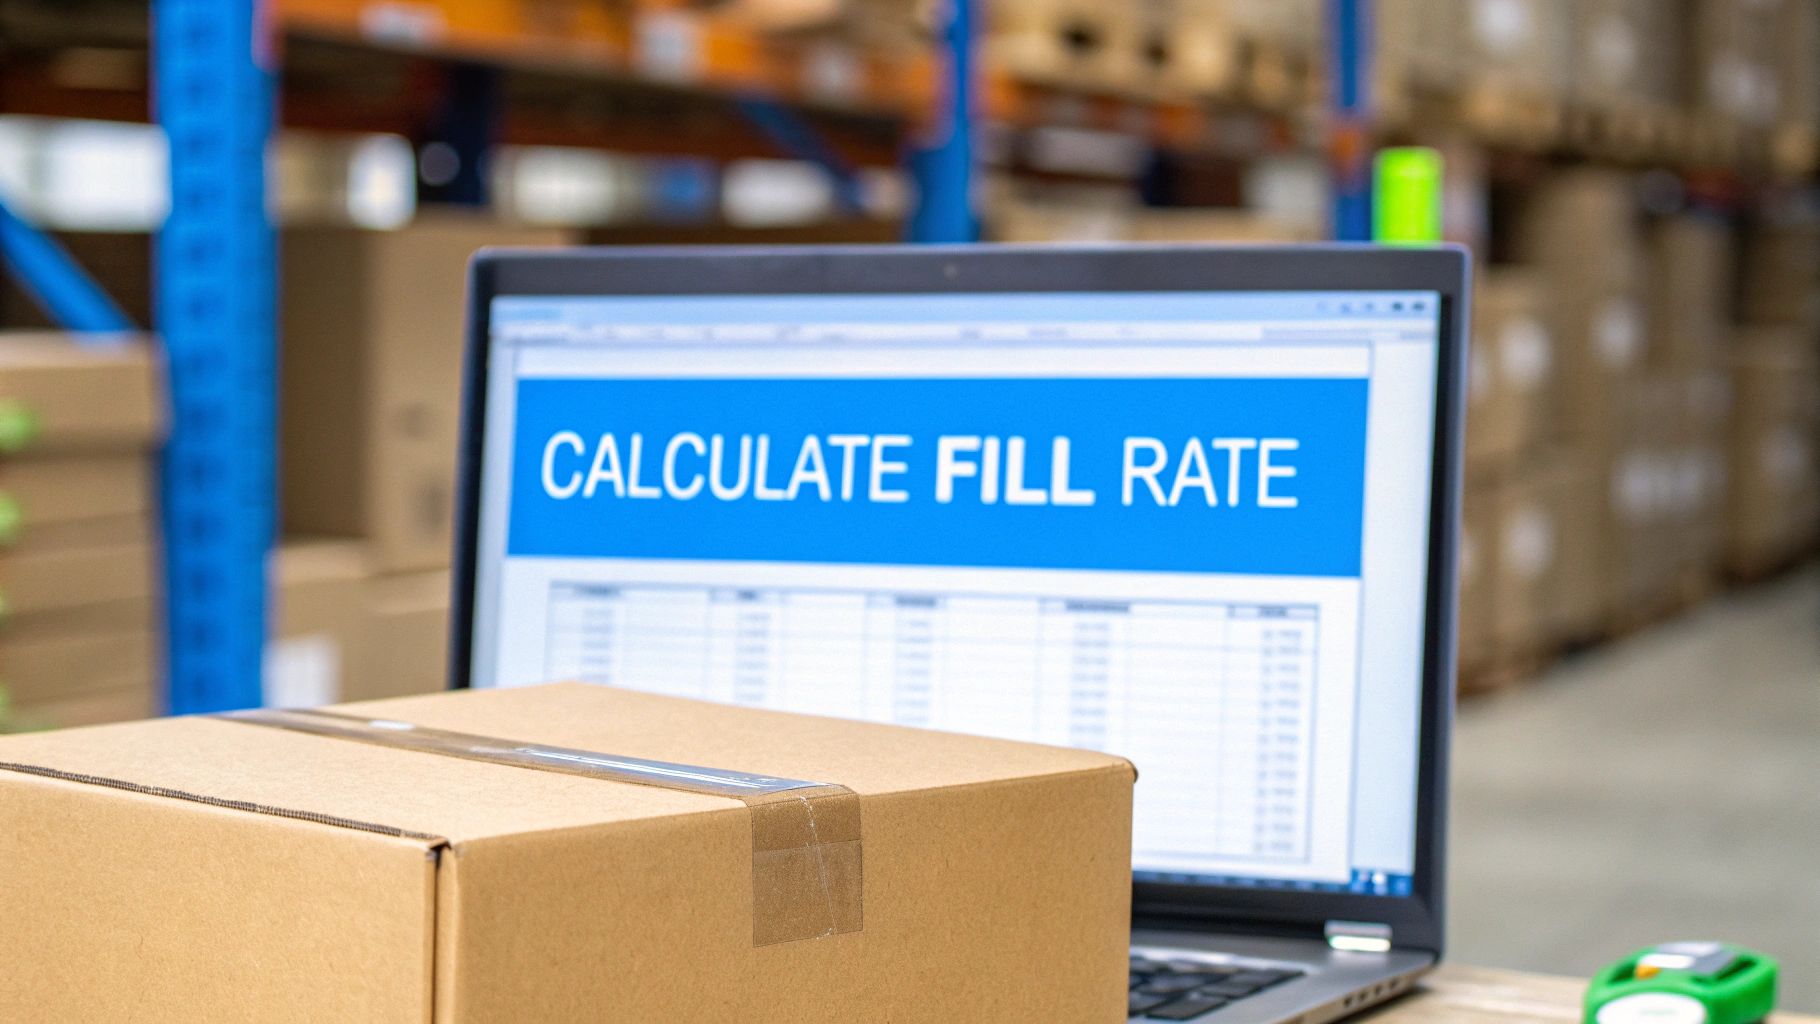
Running an e-commerce business without accurate forecasting is like sailing a ship without a compass. You might stay afloat for a while, but you're leaving your destination to chance. The cost of 'gut-feel' inventory management is steep: lost sales from stockouts, wasted capital tied up in overstock, and unhappy customers. The right inventory forecasting methods transform this guesswork into a strategic advantage, allowing you to anticipate customer demand, optimize cash flow, and scale with confidence. A solid forecast is a cornerstone of your entire business plan; Pour renforcer votre compréhension de la prévision et son impact sur la croissance, il est utile d'explorer les diverses techniques de prévision des ventes , un élément clé de la planification d'inventaire.
This guide moves beyond theory to provide a detailed roundup of seven essential forecasting techniques, from simple moving averages to advanced machine learning. We will explore how each method works, identify its specific pros and cons, and offer actionable steps for implementation. By the end, you'll be equipped to choose and apply the right strategies to make data-driven decisions that fuel sustainable growth for your business.
1. Moving Average Method The Moving Average Method is one of the most foundational and straightforward inventory forecasting methods . It operates on a simple principle: future demand will likely resemble recent past demand. This technique calculates the average demand over a specific number of recent periods to create a forecast, smoothing out short-term fluctuations to reveal a clearer underlying pattern.
There are two primary variations. The Simple Moving Average (SMA) gives equal weight to all historical data points included in the calculation. The Weighted Moving Average (WMA) , on the other hand, assigns more importance to recent data, making it more responsive to recent shifts in demand. This method is a cornerstone of many inventory control systems and can be a powerful tool for maintaining optimal stock levels.
When to Use This Method The Moving Average method is ideal for products with relatively stable demand that isn't heavily influenced by seasonality or pronounced trends. It excels at filtering out random "noise" in your sales data.
Example 1: Retail Staples. A large retail chain might use a 3-month moving average to forecast demand for consistently selling items like socks, basic t-shirts, or household cleaning supplies.Example 2: Manufacturing Materials. A manufacturer with steady production schedules can use this method to predict the need for common raw materials like screws, standard plastics, or basic metal components.Example 3: Grocery Essentials. A grocery store forecasting demand for non-seasonal items like bread, milk, or eggs would find the moving average method highly effective for its simplicity and reliability.Implementation Tips To get the most out of this method, choosing the right time period is crucial.
For Stable Products: Use a longer period, such as 3-6 months, to create a smoother, more stable forecast.For Trending Products: Use a shorter period, like 2-4 weeks, to make your forecast more responsive to recent changes.Emphasize Recency: If you notice demand is changing, implement a weighted moving average to give more significance to the latest sales figures.Monitor Accuracy: Regularly compare your forecasts to actual sales. If you consistently over- or under-stock, adjust the length of your moving average period accordingly. This process is a key part of effective inventory control. For more insights, you can explore essential inventory control methods for e-commerce to refine your strategy.2. Exponential Smoothing Exponential Smoothing is a sophisticated time-series technique and one of the most powerful inventory forecasting methods available. Similar to the moving average, it uses past data to predict future demand, but with a crucial difference: it applies exponentially decreasing weights to older observations. This means the most recent data has the most significant impact on the forecast, while the influence of older data diminishes over time, making it highly responsive to recent changes.
The method, developed by Robert G. Brown, has several variations. Simple Exponential Smoothing is used for data without a trend or seasonality. For data with a clear trend, Double Exponential Smoothing (Holt's method) is used. For products with both trend and seasonal patterns, Triple Exponential Smoothing (Holt-Winters method) is the most comprehensive and widely used version.
When to Use This Method Exponential Smoothing is incredibly versatile and can be adapted to various demand patterns, from stable to trending and seasonal. It is a step up from moving averages when you need a forecast that is more dynamic and accounts for complex patterns.
Example 1: E-commerce Giants. Amazon utilizes advanced variations of exponential smoothing in its vast supply chain to forecast demand for millions of products, adapting to trends and regional purchasing habits.Example 2: Seasonal Retail. A retailer like Walmart employs the Holt-Winters method to forecast demand for seasonal merchandise such as holiday decorations, swimwear, or back-to-school supplies, aligning inventory with predictable annual peaks.Example 3: Service Industries. Airlines can use double exponential smoothing to forecast passenger demand on specific routes, accounting for long-term growth trends to optimize flight schedules and pricing.Implementation Tips Properly configuring the smoothing parameters is key to leveraging this method's full potential.
Set Your Smoothing Constant (Alpha): Start with a low alpha (e.g., 0.1 to 0.3) for products with stable demand. For items with more volatile demand, use a higher alpha to make the forecast more reactive to recent sales.Account for Seasonality: If your product has clear seasonal spikes (e.g., winter coats, summer drinks), use the Holt-Winters method. This will build the seasonal cycle directly into your forecast model.Monitor Forecast Accuracy: Continuously track forecast error metrics. If your model is consistently inaccurate, you may need to adjust your smoothing parameters (alpha, beta for trend, and gamma for seasonality).Consider Automation: Many modern inventory management systems can automatically optimize these parameters based on historical performance, saving time and improving forecast accuracy.3. ARIMA (AutoRegressive Integrated Moving Average) ARIMA stands as one of the most sophisticated and powerful statistical inventory forecasting methods available. Popularized by statisticians George Box and Gwilym Jenkins, this model analyzes time-series data to provide highly accurate forecasts. It works by combining three distinct statistical processes to capture different aspects of the data.
The model’s components are AutoRegression (AR) , which uses the relationship between an observation and a number of past observations; Integrated (I) , which involves differencing the raw data to make it stationary (removing trends); and Moving Average (MA) , which accounts for the dependency between an observation and the residual errors from a moving average model. By combining these, ARIMA can model complex demand patterns with remarkable precision.
When to Use This Method ARIMA is best suited for businesses with large datasets and products that exhibit complex trends or seasonality. It requires historical data to identify patterns and is ideal for long-term strategic planning.
Example 1: CPG Demand Planning. A company like Procter & Gamble can use ARIMA to create long-term forecasts for entire product categories, considering historical sales trends and market dynamics to optimize its global supply chain.Example 2: Pharmaceutical Forecasting. Drug manufacturers use ARIMA to predict demand for medications, factoring in elements like patent expirations, disease prevalence trends, and seasonal illnesses to prevent stockouts or oversupply.Example 3: Energy Consumption. Utility companies leverage ARIMA to predict electricity demand, modeling complex seasonal patterns (e.g., higher usage in summer and winter) to ensure grid stability and efficient energy generation.Implementation Tips Properly implementing an ARIMA model requires a good understanding of its statistical underpinnings.
Ensure Data Stationarity: Before building the model, you must transform your data to have a constant mean and variance over time. This is what the "Integrated" part of ARIMA helps achieve through differencing.Use AIC/BIC for Model Selection: Use criteria like the Akaike Information Criterion (AIC) or Bayesian Information Criterion (BIC) to help select the optimal number of AR and MA terms, balancing model complexity with forecast accuracy.Validate with Out-of-Sample Testing: Always test your model on a holdout dataset (data it hasn't seen before) to validate its predictive power and ensure it isn’t just overfitting to past data.Consider Seasonal ARIMA (SARIMA): For products with clear seasonal patterns, use a SARIMA model. This extension of ARIMA adds a seasonal component to explicitly model recurring yearly, quarterly, or monthly cycles.4. Causal/Regression Analysis Causal/Regression Analysis is an advanced and powerful inventory forecasting method that moves beyond just historical sales data. It works by identifying and quantifying the cause-and-effect relationships between product demand and various external factors. This statistical technique builds a predictive model by linking sales to independent variables like economic indicators, promotional activities, competitor pricing, or even weather patterns.
Unlike time-series methods that look inward at past performance, causal models look outward to understand the "why" behind demand shifts. By pinpointing the key drivers of sales, businesses can create highly accurate forecasts that account for market dynamics. This makes it an invaluable tool for strategic planning, especially when launching new products or entering new markets where historical data is nonexistent.
When to Use This Method This sophisticated method is best suited for businesses whose sales are significantly impacted by external, quantifiable factors. It’s particularly effective for strategic, long-term planning and for products sensitive to market conditions.
Example 1: Home Improvement. A retailer like Home Depot can correlate lumber sales with new housing start data and regional weather forecasts to predict demand spikes.Example 2: Beverage Industry. Coca-Cola might use a causal model that incorporates temperature data, major sporting events, and economic health indicators to forecast beverage sales.Example 3: Fast Fashion. A fashion retailer can use social media trends, influencer marketing campaigns, and competitor promotions as variables to predict demand for a new clothing line.Implementation Tips Successfully implementing Causal/Regression Analysis requires a focus on data quality and model validation.
Start Simple: Begin by identifying the most obvious causal relationships, like the impact of a 20% off promotion on sales. Gradually add more complex variables as you validate their influence.Validate Relationships: Regularly test and update your model to ensure the causal relationships remain relevant. Economic conditions and consumer behaviors can change over time.Combine Methods: For a more robust forecast, combine causal analysis with a time-series method like seasonal indexing. This allows you to forecast a baseline and then adjust it based on external factors.Ensure Reliable Data: The accuracy of your forecast depends on the accuracy of the data for your causal variables. If you are forecasting based on economic growth, you need a reliable forecast for that indicator itself. To learn more about how this fits into a broader strategy, you can explore the various types, examples, and methods of demand forecasting .5. Machine Learning and AI Forecasting Machine Learning (ML) and Artificial Intelligence (AI) represent the most advanced and powerful frontier of inventory forecasting methods . Unlike traditional statistical models that follow pre-defined rules, AI techniques leverage complex algorithms like neural networks, random forests, and deep learning to autonomously analyze vast datasets. These models can identify subtle, non-linear patterns and relationships among hundreds of variables, from sales history to weather patterns, social media trends, and macroeconomic indicators, to produce highly accurate demand predictions.
This diagram illustrates the fundamental pipeline for implementing an ML forecasting system, from initial data gathering to deploying the final predictive model.
The flow from data collection to model training and finally to deployment highlights a cyclical process where predictions are continuously refined as new data becomes available. This adaptability is what makes ML-driven approaches, especially popular with tech giants like Amazon and Google, so effective for modern supply chains.
When to Use This Method AI and ML forecasting are best suited for businesses with large, complex datasets and dynamic market conditions where traditional methods fall short. They excel at predicting demand for products affected by numerous, interacting factors.
Example 1: Fast Fashion. Zara uses ML algorithms to analyze real-time sales data from stores worldwide, allowing it to rapidly forecast demand for new styles and adjust inventory within days, minimizing overstock of unpopular items.Example 2: Global Service Networks. Tesla applies neural networks to forecast the demand for replacement parts across its global service centers, factoring in vehicle age, mileage, and regional driving conditions to optimize part availability.Example 3: Content Demand. Netflix employs sophisticated deep learning models to predict viewer demand for content in different regions, informing its massive investment in original programming and content licensing.Implementation Tips Deploying ML forecasting requires a strategic approach and a focus on data quality.
Start Simple: Begin with more straightforward algorithms like random forests before progressing to complex deep learning models. This helps establish a baseline and understand your data better.Prioritize Data Quality: Ensure your training data is clean, comprehensive, and accurate. ML models are only as good as the data they are trained on, so garbage in, garbage out.Prevent Overfitting: Use techniques like cross-validation to ensure your model can generalize to new, unseen data and isn't just memorizing the training set.Use Ensemble Methods: Combine the predictions from multiple different algorithms (an ensemble) to achieve higher accuracy and robustness than any single model could provide alone. Gaining a deeper understanding of these concepts is crucial, and you can explore more by understanding demand forecasting in ecommerce to build a solid foundation.6. Collaborative Planning, Forecasting and Replenishment (CPFR) Collaborative Planning, Forecasting, and Replenishment (CPFR) elevates forecasting from an internal process to a strategic partnership. This is one of the more advanced inventory forecasting methods , uniting retailers, distributors, and manufacturers to align on a single, shared demand forecast. Instead of each company creating its own predictions in a silo, CPFR combines intelligence and data across the entire supply chain.
This business practice integrates demand and supply side planning to improve operational efficiency for all participants. By synchronizing data and plans, partners can reduce forecast errors, minimize safety stock, and respond more effectively to market changes. It’s a proactive approach designed to eliminate guesswork and foster transparency between trading partners.
When to Use This Method CPFR is best suited for businesses with strong, strategic relationships with their supply chain partners. It is most effective for products that are critical to the business, have high volume, or experience significant demand volatility where shared insight can provide a competitive edge.
Example 1: Retail Titans and CPGs. Walmart’s pioneering CPFR program with suppliers like Procter & Gamble is a classic case. By sharing point-of-sale data and joint business plans, they dramatically improved in-stock rates and reduced inventory costs for both parties.Example 2: Specialty Retailers. West Marine, a specialty retailer of boating supplies, uses CPFR with key boat manufacturers. This collaboration helps them align on seasonal demand for specific parts and accessories, ensuring availability during peak boating season.Example 3: Beverage Industry. Heineken implements CPFR with its major retail partners to manage promotions and new product launches, ensuring that production and distribution are perfectly synced with marketing efforts to prevent stockouts.Implementation Tips Successfully launching a CPFR initiative requires trust, technology, and a structured approach.
Start with a Pilot Program: Begin with your most trusted and strategic partners. A successful pilot will build a business case and create a blueprint for expanding the program.Establish Clear Protocols: Define the rules of engagement upfront. Create clear governance for what data is shared, how often, and who is responsible for each step of the forecasting and replenishment process.Invest in Compatible Technology: Use technology platforms that allow for seamless and secure data sharing between you and your partners. The system must be able to integrate different data sources into a single view.Focus on High-Impact Products: Concentrate your initial efforts on high-volume, strategic products where forecasting accuracy has the biggest financial impact. The insights gained from a strong demand planning process are crucial for selecting these items.7. Demand Sensing Demand Sensing is a powerful, short-term approach among modern inventory forecasting methods . It moves beyond historical sales data by incorporating near-real-time information from multiple sources to detect and react to shifts in customer demand almost instantly. This technique combines traditional forecasts with current market signals like point-of-sale (POS) data, social media trends, competitor pricing, and even weather patterns to create highly accurate, granular predictions.
This method uses sophisticated algorithms and machine learning to analyze daily or even hourly data, allowing businesses to respond proactively to sudden spikes or dips in demand. By identifying these short-term patterns, companies can adjust inventory levels, marketing efforts, and supply chain logistics with incredible agility. This reduces the risk of stockouts on popular items and minimizes overstock on products with waning interest.
When to Use This Method Demand Sensing is best suited for businesses operating in dynamic, fast-paced markets where demand is volatile and influenced by numerous external factors. It is particularly effective for products with short life cycles or those subject to promotions and unpredictable events.
Example 1: CPG and FMCG. A company like Unilever can use demand sensing to forecast ice cream sales. By analyzing real-time POS data from retailers alongside local weather forecasts and social media sentiment, it can predict a surge in demand during a heatwave and ensure stores are stocked accordingly.Example 2: Fashion and Apparel. A brand like Nike can leverage demand sensing for a new sneaker launch. It can monitor social media buzz, influencer mentions, and early online sales data to rapidly adjust its distribution strategy, sending more inventory to regions with the highest engagement.Example 3: Pharmaceuticals. A pharmaceutical company can use anonymized prescription data and public health alerts to sense rising demand for a specific drug, helping to prevent shortages during an unexpected flu season or a localized outbreak.Implementation Tips To successfully implement demand sensing, the focus must be on data quality and technological capability.
Establish Real-Time Data Feeds: Invest in the technology needed to capture and process real-time data from critical sources, including POS systems, social media APIs, and syndicated market data providers.Complement, Don't Replace: Use demand sensing to fine-tune your short-term operational plans, not to replace your long-term strategic forecasts. It answers "what do we need next week?" while other methods answer "what do we need next quarter?"Implement Automated Alerts: Set up systems that automatically flag significant deviations from the forecast. This allows your team to react quickly to opportunities or threats without needing to constantly monitor dashboards.Start with High-Volatility Products: Begin by applying demand sensing to your most unpredictable products. This is where you will see the greatest immediate return on investment and can refine your process before expanding.Inventory Forecasting Methods Comparison Method Implementation Complexity Resource Requirements Expected Outcomes Ideal Use Cases Key Advantages Moving Average Method Low Minimal computational resources Smooths demand, good for stable patterns Products with stable, consistent demand Easy to implement, baseline forecasting method Exponential Smoothing Moderate Minimal data storage Responsive to trends and seasonality Products with trends and seasonal patterns Adaptive; handles trends and seasonality ARIMA High Substantial data and computational power High accuracy for complex series Complex time series with trends, seasonality Flexible, statistically sound forecasts Causal/Regression Analysis High Extensive data collection on causal factors Explains demand drivers, predicts external impacts Products influenced by external variables Explains cause-effect; supports scenario planning Machine Learning and AI Forecasting Very High Significant technical infrastructure Captures complex non-linear patterns Large data sets with multiple variables Handles complex patterns; continuously improves Collaborative Planning, Forecasting and Replenishment (CPFR) High Coordination and compatible technology Improved forecast accuracy via collaboration Supply chains requiring partner coordination Reduces bullwhip; enhances partner alignment Demand Sensing Moderate Real-time data integration Rapid response to demand changes Products with volatile or unpredictable short-term demand Highly responsive; reduces short-term forecast error
Choosing Your Method and Partnering for Success Navigating the landscape of inventory forecasting methods can feel complex, but the journey from uncertainty to clarity is a powerful driver of business growth. We've explored a spectrum of techniques, from the foundational simplicity of the Moving Average method to the predictive power of AI-driven forecasting and the collaborative strength of CPFR . The central lesson is clear: there is no single, universal "best" method. Instead, the optimal approach is a dynamic and customized one.
The most resilient e-commerce brands build a forecasting toolkit, not a rigid, one-size-fits-all process. Your strategy should be agile, allowing you to select the right tool for the right situation.
Building Your Forecasting Toolkit Your path forward involves moving from theory to practice. The key is to match the method to the specific context of your products and market conditions. Consider these practical next steps:
For Stable, Predictable Products: Begin with Moving Averages or Exponential Smoothing . These methods are excellent for items with consistent sales history and minimal seasonality, providing a reliable baseline without requiring extensive data science expertise.For Seasonal or Trending Items: When you have products with clear, repeating patterns, ARIMA or Causal Analysis become invaluable. Use these to account for predictable peaks and troughs, ensuring you're stocked for high-demand periods like holidays and prepared for the lulls that follow.For New Product Launches or Volatile Markets: When historical data is scarce or unreliable, turn to forward-looking methods. Causal Analysis can link demand to marketing spend or competitor actions, while Demand Sensing leverages real-time signals for immediate adjustments. Machine Learning models can uncover hidden correlations that traditional methods miss.The most sophisticated strategy is often a hybrid one. You might use exponential smoothing for your core product line while applying a causal model for a new product you're heavily promoting. The goal is to create a flexible system that adapts to the unique lifecycle and demand drivers of each SKU in your catalog.
From Forecast to Fulfillment: The Final, Critical Link Ultimately, even the most precise forecast is only valuable if it translates into flawless operational execution. An accurate prediction of a sales spike means nothing if your fulfillment process can't handle the surge, leading to stockouts, shipping delays, and frustrated customers. This is where your operational infrastructure, particularly your fulfillment partner, becomes a strategic asset.
Your choice of inventory forecasting methods depends on clean, accessible, and real-time data. A technologically advanced 3PL partner provides the foundational data hub, integrating with your sales channels like Shopify or WooCommerce to centralize the very information your models need to function. They are the bridge between your predictive analytics and the physical reality of getting products to your customers. By aligning your carefully crafted forecasts with a partner capable of executing on them with speed and precision, you transform predictions into profit and build a brand known for its reliability.
Ready to align your sharp forecasts with flawless execution? Simpl Fulfillment integrates seamlessly with your sales channels, providing the real-time data you need for accurate inventory forecasting methods and the operational muscle to turn those predictions into perfectly delivered orders. Discover how Simpl Fulfillment can empower your growth today.